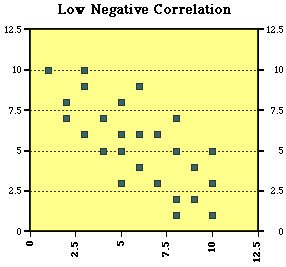
A scatter plot displays bivariate data within
a form of a graph. The graph will show the relationship of the two variables,
any connection pattern of the data.
The example map is of a scatter plot map
lecture from the University of MSTE in Illinois.

No comments:
Post a Comment