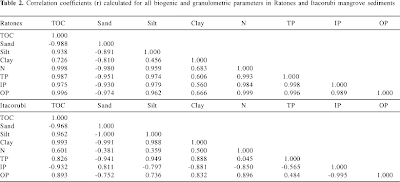
A correlation matrix displays a variety of
data in a rectangular form. The matrix allows the display of a variable and the
correlation of the additional data. Within the matrix, when same variables are compared,
the value/coefficient is always 1 and is shown diagonally within the chart.
The example correlation matrix is the data
from the assessment of lipid compounds
and phosphorus in mangrove sediments of Santa Catarina Island, SC, Brazil

No comments:
Post a Comment