
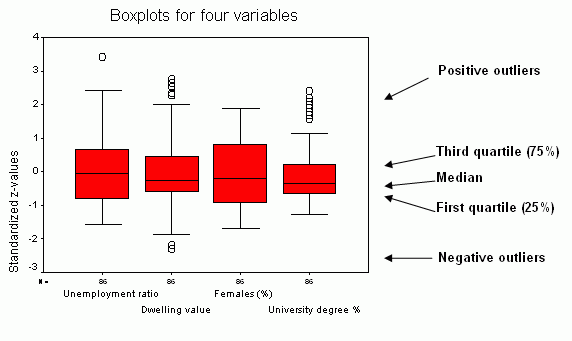
A box plot is a graphical display by an
interval scale. The plot displays the distribution, central values and variability’s
of the data. If any of the data is not within the designated box plot graph,
then the information is known as outliners and is generally noted with an
asterisk.
The example map, “Illustrates that there are
positive outliers for three variables and negative outliers for one variable.
The variable Females(%) does not have outliers at all. In
addition to outliers, there can be positive or negative extremes extending the
value of three interquartile ranges above the third quartile and below the
first quartile. None of the analyzed variables has extremes. Eliminating
outliers and extremes (for example, negative outliers or extremes for zero
representing no data), can change radically the distribution of a variable.”
Per the web citation.
No comments:
Post a Comment